Marlin Prowell
E34 - Bellingham, WA
If you sail in the Pacific Northwest, you are undoubtably familiar with the Canadian Current Atlas. The cover is below, and is full of 93 map pages full of arrows, all slightly different. Map 4 is pictured below.


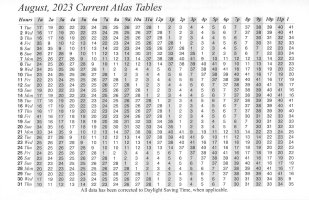
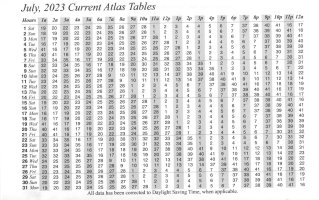
The Canadian Current Atlas preamble contains 4 pages that explain how to calculate the correct map to use for every hour of a day. Nobody I know does the calculations. Instead they buy a pamphlet each year that has each hour calculated and listed in a table. The pamphlet used to be called Washburne's Tables, but is now titled Waggoner Tables. The table for July 2023 is shown below.


You look up the day you are going sailing and find the numbers of the maps, hour by hour, for that day. You then start looking through those maps, comparing all the maps for the day to see when would be the best time, current wise, for you to leave. A little tedious, but better than performing lots of calculations to find the correct map numbers. I bought the Washburne's Tables pamphlet for many years.
But you don't have to buy a new Waggoner Tables pamphlet each year. A few years ago I found a free on-line source for the current atlas tables. Emanuel Borsboom provides a set of tables, free for non-commercial use. He wrote some scripts that do the calculations and created a PDF of the monthly tables for each year. You can find his tables for the next eight years here.
Times have changed and paper charts are no longer readily available. So, too, with the Canadian Current Atlas. The atlas is no longer in print. Instead the Canadian government provides a PDF of the Canadian Current Atlas. It is Volume 3 on this web page.
Now checking currents has become awkward. First you find the desired map number on a page of the tables PDF, then find the map itself in the atlas PDF. Of course the map numbers in the atlas PDF do not match the PDF page number, so hunting for the wanted map is necessary. This should be easier.
A small software firm has done just that. You can now get an iOS or Android app that has all the current maps preloaded on your phone or tablet. You can look up any date and time to see the corresponding map. Best of all, there are forward and backward arrows to step forward and backward in time, one map at a time. Seeing the current changes from hour to hour is now immediately obvious. The app is called Current Atlas sold by Tiny Octopus and a tablet screen shot is shown below.

Checking the currents for your next trip could not be easier!
The Canadian Current Atlas preamble contains 4 pages that explain how to calculate the correct map to use for every hour of a day. Nobody I know does the calculations. Instead they buy a pamphlet each year that has each hour calculated and listed in a table. The pamphlet used to be called Washburne's Tables, but is now titled Waggoner Tables. The table for July 2023 is shown below.
You look up the day you are going sailing and find the numbers of the maps, hour by hour, for that day. You then start looking through those maps, comparing all the maps for the day to see when would be the best time, current wise, for you to leave. A little tedious, but better than performing lots of calculations to find the correct map numbers. I bought the Washburne's Tables pamphlet for many years.
But you don't have to buy a new Waggoner Tables pamphlet each year. A few years ago I found a free on-line source for the current atlas tables. Emanuel Borsboom provides a set of tables, free for non-commercial use. He wrote some scripts that do the calculations and created a PDF of the monthly tables for each year. You can find his tables for the next eight years here.
Times have changed and paper charts are no longer readily available. So, too, with the Canadian Current Atlas. The atlas is no longer in print. Instead the Canadian government provides a PDF of the Canadian Current Atlas. It is Volume 3 on this web page.
Now checking currents has become awkward. First you find the desired map number on a page of the tables PDF, then find the map itself in the atlas PDF. Of course the map numbers in the atlas PDF do not match the PDF page number, so hunting for the wanted map is necessary. This should be easier.
A small software firm has done just that. You can now get an iOS or Android app that has all the current maps preloaded on your phone or tablet. You can look up any date and time to see the corresponding map. Best of all, there are forward and backward arrows to step forward and backward in time, one map at a time. Seeing the current changes from hour to hour is now immediately obvious. The app is called Current Atlas sold by Tiny Octopus and a tablet screen shot is shown below.
Checking the currents for your next trip could not be easier!